Flags are continuation patterns that form before the market breaks a difficult level. In essence, during the formation of these patterns, the market is building energy to break through. Flags can be either bullish or bearish, and they are part of the overall trend up to that moment. The trend resumes after the flag is broken. The following are the things that make a bullish or a bearish flag:
- They are consolidation areas. Markets spend most of the time in consolidation rather than in a trending environment. This makes flags quite popular on all financial products. In the case of the Forex market, flags mostly form in the Asian session when liquidity and volatility are at a low.
- They resemble triangular formations. According to Elliott Waves theory, triangles are the most common form of market consolidation. Following this logic, if flags are consolidation areas, it means the chances are that triangles will appear during a flag’s formation.
- They are part of complex corrections. A triangle is rarely a simple correction, as most of the time it is part of a complex one. We will treat complex corrections in detail here on the Trading Academy in future articles.

Welcome Bonus
100%
Min Deposit: $100
Profit Split: up to 90%
Accounts: $25k-$200k
Challenge: 2-phase, no time limit
Welcome Bonus
10% up to $5,000
Min Deposit: $100
Welcome Bonus
$25
Min Deposit: $100
Welcome Bonus
100% Deposit Bonus
Min Deposit: €10
Welcome Bonus
100%
Min Deposit: $0
Welcome Bonus
$30
Min Deposit: $5
Bonus
NONE
Min Deposit: $100
Welcome Bonus
$50 Free
Min Deposit: $500
* T&Cs apply to each of the offers. Click “Trade” for more details
How to Trade a Flag
Before looking at ways to trade a flag, we must mention here that they are patterns that form on the horizontal, or on the opposite side of the ongoing trend. If the consolidation area is forming on the same side of the main trend (with a rising angle in a bullish trend and a falling one in a bearish trend), then the market forms a different pattern.
Wait for the Break.
Conservative traders will wait for the flag to break. This means that they place pending orders to buy or sell above the upper trendline that makes a flag.
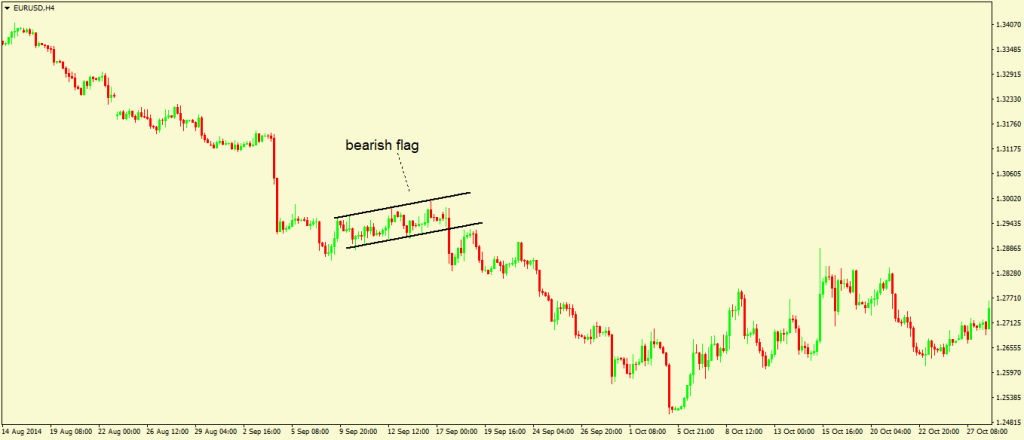
The bearish flag that can be seen above formed on the EUR/USD pair on its way lower on the 4-hour chart. It takes some time for the market to consolidate: around 40 candles. Considering the timeframe, this means that for more than a trading week, (almost one and a half weeks), the EUR/USD pair consolidated in a small range, with the flag having a rising angle. Technically oriented traders had all the time in the world to see the flag formation and to position themselves for the break to come. As mentioned above, conservative traders will place a pending sell stop order, in this case below the lower trendline that marks the flag’s formation, with a stop loss at the previous higher-high value. A proper take profit will be given by a minimum 1:2 risk:reward ratio.
Look for Confirmation.
However, the Forex market is known for giving tons of fake moves, as this is the most difficult market to be traded. Even when fundamental news points in a single direction, there are many cases when the market simply moves in the opposite one. This is because of imbalances between supply and demand levels, or because of the bigger picture accounting for more than just some news items; or maybe the fundamental news is already priced in. The same is valid in the example above. What if the market breaks the lower trendline of the flag, and then reverses and takes the stop loss in the above-mentioned set-up? To avoid this situation, we need some confirmation that the flag is completed. This confirmation comes in the form of breaking of the higher-lows series.

Using the same example on the EUR/USD 4-hour chart, it is not enough to place a pending sell stop at the lower trendline that marks the flag; we also need confirmation that the flag pattern is completed. This confirmation comes from the previous higher-lows series break. As can be seen, the move that breaks the flag lower breaks the higher-lows series in the same time, making it 100% certain that the flag is completed. The interpretation is that the main trend has resumed. The main trend is a bearish one, as the flag was a bearish flag, so staying short for the target is the right thing to do. Such consolidation areas, or flags, form before important economic events, such as a speech or an economic release, a press conference, etc. If traders are keeping an objective eye on the pattern, it is enough to position on the right side of the market by the time the pattern breaks and the main trend resumes. Bullish and bearish flags allow for the right positioning. The example we used in this article shows a flag that forms on the 4-hour chart timeframe. So what happens with a flag on the weekly or even the monthly chart? The right answer is that the interpretation is the same, and execution should be the same too. If flags are most likely to be triangles, then for the whole time the flag is still forming, traders should look at the conditions of a triangular formation, and how to trade the triangle; all of the while keeping an objective eye on the main direction of the flag, and placing a pending order at such a level that not only will the flag break, but it will invalidate the higher-lows/lower-highs series. Flags require a lot of patience and discipline, which are the main attributes of a successful Forex trader.
Moving forward, we’ll introduce the concept of a wedge in our next article, as flags and wedges are similar patterns. One difference is that wedges have the two trendlines converging at a common point somewhere in the future, while flags travel within parallel lines. The main difference between the two comes from the fact that wedges are reversal patterns, while flags are continuation ones. This way, traders know all the time what to expect from future price action when a flag or a wedge is broken. Both flags and wedges are part of the classical patterns that make up technical analysis, and it is mandatory to know how to treat them. They appear often, and they leave little or no room for error.
Recommended Further Readings
- Forex Trading – Explaining the Concept
– What is Forex trading? Generalities about trading the currency market. - Why Trading Forex?
– Advantages and disadvantages of trading the currency market; what are trader’s expectations? and what is a realistic approach to follow? - Why Trading with a Regulated Forex Broker?
– What regulation is for a brokerage house; why it is important; and things to look for, such as how to check whether the broker is telling the truth, etc. - Benefits of Mobile Forex Trading
– Pros and cons of mobile trading, highlighting the net benefits of it. - Explaining Commissions in Forex Trading
– What type of Forex trading accounts are subject to paying commissions; what it means; and whether this is a good or a bad thing. - Opening a Live Trading Account
– Steps to open a live trading account with a Forex broker, starting with the time taken for the whole process, documentation to be sent, verification process, trading platforms to download, etc.
Other Educational Materials
- Chart Patterns Trader. Matras K.
- Testing the Power of Technical Analysis for Forecasting the Market Trend and Future Price in FOREX Market Kermanshahi, S. (2014). (Doctoral dissertation, Eastern Mediterranean University (EMU)-Doğu Akdeniz Üniversitesi (DAÜ)).