Triangles are the most common way for a market to consolidate. Corrections or consolidations are the way markets spend most of their time, and this makes triangles important patterns. A triangle can either contract or expand, but expanding triangles should be considered as rare patterns. An expanding triangle (implying that the waves that follow the first one are each bigger than the previous wave) is difficult to find, not only on the Forex market but in any market. The focus should therefore stay on contracting triangles, and these can be either ascending or descending, limiting or non-limiting, and the list can go on. No matter what the purpose, though, a triangle is a powerful pattern in technical analysis.
Continuation Patterns
Ascending or descending triangles are continuation patterns. This means that the market will resume the trend prior to the triangular formation. In plain English, the market is just consuming time to break levels, as an imminent break is coming. Depending on the timeframe a triangle is forming on, this may take time, but the overall principle is the same. Before describing ascending and descending triangles, it is important to mark the conditions that make a triangle:
- They are three-wave structures. This means that all the legs of a triangle are corrective in nature.
- They have five segments. A triangle has no more and no less than five segments/legs/waves. All of them, as mentioned above, are corrective.
- According to Elliott Waves theory, they are labelled with letters. This is an important feature, as Elliott Waves allows us to correctly draw the triangle’s trend lines.
- They travel between two trend lines. These are the a–c and b–d trend lines.
- The most important one is the b–d trend line. When this one is broken, the triangle is considered completed, and the previous trend resumes.

Welcome Bonus
100%
Min Deposit: $100
Profit Split: up to 90%
Accounts: $25k-$200k
Challenge: 2-phase, no time limit
Welcome Bonus
10% up to $5,000
Min Deposit: $100
Welcome Bonus
$25
Min Deposit: $100
Welcome Bonus
100% Deposit Bonus
Min Deposit: €10
Welcome Bonus
100%
Min Deposit: $0
Welcome Bonus
$30
Min Deposit: $5
Bonus
NONE
Min Deposit: $100
Welcome Bonus
$50 Free
Min Deposit: $500
* T&Cs apply to each of the offers. Click “Trade” for more details
Ascending Triangle
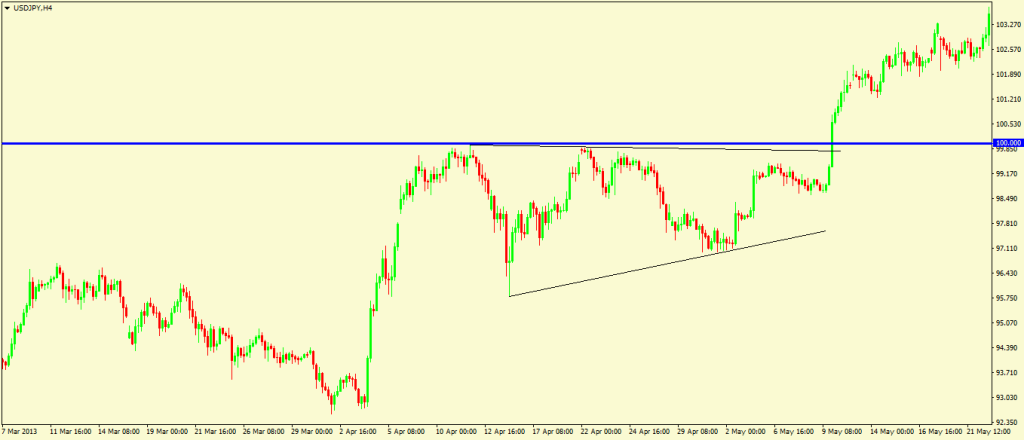
An ascending triangle is a bullish pattern. Having said that, it means that the previous trend prior to the triangular formation was a bullish one. The implications are that the trend will resume after the triangle is completed. The perfect example of a well-known ascending triangle comes from the USD/JPY pair.
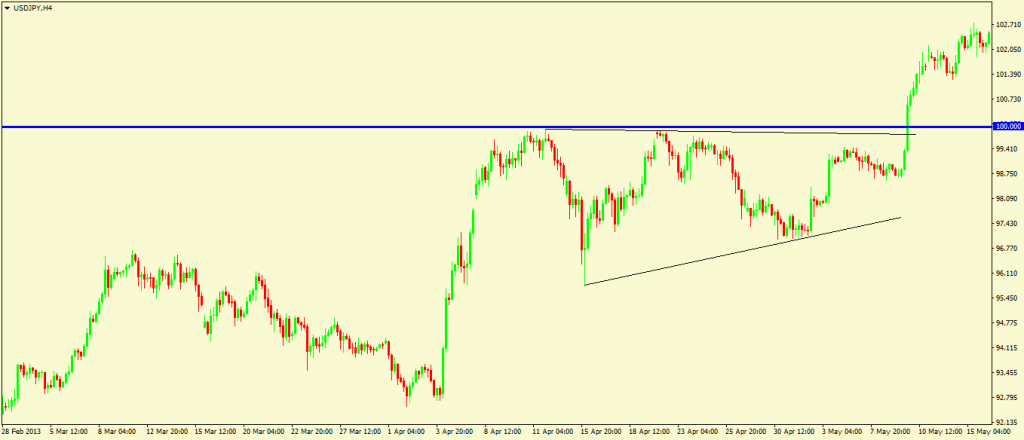
The triangle above formed on the USD/JPY pair in the middle of an impressive trend. The pair jumped from below 80 to the 100 level as the Bank of Japan embarked, a few years ago, on an aggressive quantitative easing programme. Under such a programme, the central bank buys its own government bonds. The idea behind this unconventional tool is to ease the monetary policy to bring back inflation. A specific inflation level is desired and needed for an expanding economy. In this case, the side effect of such a monetary policy tool is an aggressive currency weakening. It happened in the United States as well, as the Federal Reserve ran four different quantitative easing programmes, and thus the US dollar suffered accordingly. Coming back to the USD/JPY pair, before reaching the all-important 100 level, a psychological one, the market dipped. The dip was a significant one, meant to scare bulls, as the pair travelled more than 500 pips to the downside. However, it turned out that it was only the first leg of an ascending triangle; the market was simply looking to consume more time before breaking above the 100 level. Eventually, after almost 200 4-hour candles, the level was broken and the bullish trend resumed. The moment the b–d trend line was broken, the triangle completed.
Descending Triangles
Descending triangles are similar, the only difference being that the outcome is a bearish rather than a bullish one. I’ll give you the EUR/USD daily chart as an example here, as the pair formed a beautiful descending triangle on its way down from 1.40 to the 1.04 area. Can you spot a triangle in the chart below? Remember to look for continuation patterns; in this case, for bearish continuation patterns.
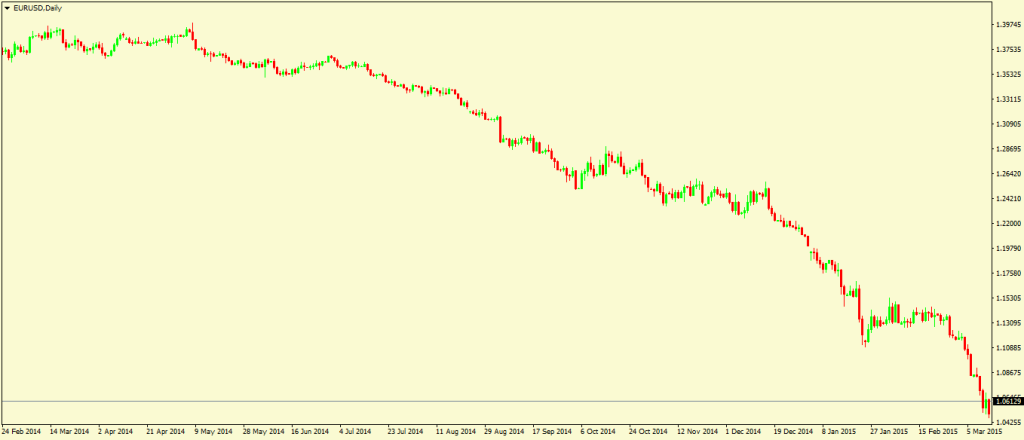
Keep in mind that in real trading charts, patterns are not like the ones in trading books or courses. The market takes various shapes, and thus triangles are not always horizontal.
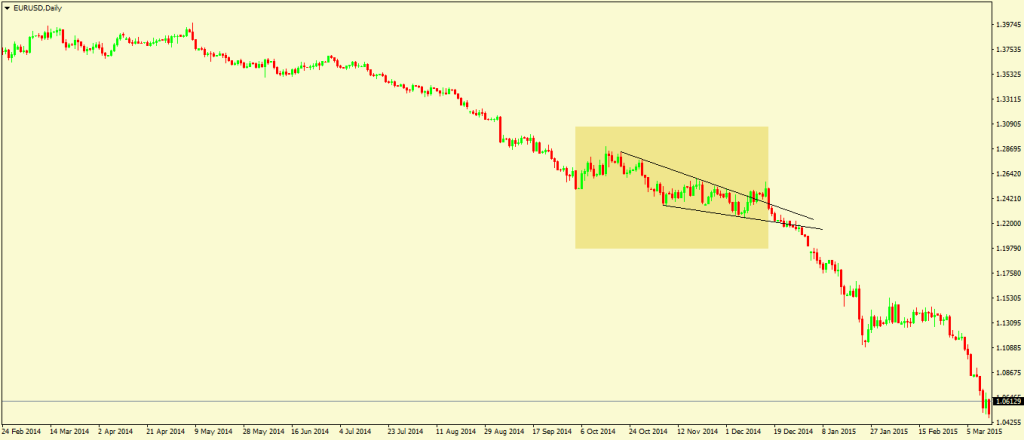
Here is the descending triangle I was talking about. It is a continuation pattern, meaning that the trend prior to the triangular formation is a bearish one, and the trend continues after the triangle is completed. As in the USD/JPY example, the moment the lower trend line (the b–d trend line according to Elliott Waves theory) broke, the bearish trend resumed. As you can see in the image above, the triangle is not a horizontal pattern. However, this is irrelevant; what matters here is the fact that it acted as a continuation pattern. Aggressive traders position for its break during the triangular formation, while conservative traders simply wait for the lower trend line to break.
Such patterns as ascending and descending triangles appear in many places under the Elliott Waves theory. They can be part of complex corrections (most of the times) or simple ones. A triangle as a simple correction is a rarity, though, and traders should expect a complex one to end there. The most common place for a triangle to appear is at the end of a complex correction. Therefore, in the case of the USD/JPY, the triangle was most likely part of a running correction, which started at a lower level and ended when the triangle completed. The same is valid in the case of the EUR/USD descending triangle. Ascending and descending triangles have one thing in common: they resemble a triple top or bottom formation. As a reminder, a triple top/bottom pattern is a reversal pattern. However, in trading, there is a saying: triple tops/bottoms rarely hold; and because they rarely work, triangles form. These patterns are so common that they form on every currency pair, in every timeframe, and they can be easily traded. The only thing that needs to be done is to adjust expectations based on the timeframe and the pattern that forms.
Recommended Further Readings
- Basics of Technical Analysis
– What technical analysis is; why it is important; and why traders are using it. Advantages over fundamental analysis are highlighted as well. - Basics of Fundamental Analysis
– What fundamental analysis is; where to look for information that makes the market move; and advantages and disadvantages of trading based on fundamentals. - Trend Indicators
– Explaining what trading indicators are; where to find them; and their benefits when trading Forex market based on technical analysis. - Oscillators
– Discussing what oscillators are; the differences between an oscillator and a trend indicator; and the most representative indicators that fit into this category. - Central Banks
– The role of a central bank in Forex trading; why the market moves aggressively when monetary policy is set; and what information to look for when the central bank is decides on its policy. Technical Analysis – Support and Resistance Areas
– Defining what support and resistance areas are; how to find them using technical analysis; and why traders look to buy into support and sell into resistance.
Other Educational Materials
- A joint review of technical and quantitative analysis of the financial markets towards a unified science of intelligent finance. Pan, H. P. (2003, June). In Proc. 2003 Hawaii International Conference on Statistics and Related Fields, June (pp. 5-9).
- Pattern matching in financial time series data. final project report for ICS, Ge, X., 1998. 278.