In the same category like classical support and resistance levels, pivot points are horizontal lines on the screen designed to offer either a stop loss or a take profit for a trade. A pivot point strategy can be used mostly on scalping rather than swing trading or investing. The MetaTrader platform is not offering the Pivot Points indicator with the standard or the default settings, but this should not be a problem for those that want to use it. Just create an account to the mql.com community (MetaTrader developers offer a wide range of trading tools from indicators to Expert Advisors, either for free or for a small fee) and search for the Pivot Points indicator to download on the MetaTrader 4 platform. You’ll find plenty of offers available and after downloading one on your computer, it is time to install it on the trading platform. This is even easier to be done if you follow the steps below:
- Open the MetaTrader platform.
- From the File tab (the first one on the left on the main menu) chose the “Open data folder” tab, and from the pop-up window select the MQL4 folder.
- Open the Indicators folder.
- Paste the Pivot Points indicator in this folder.

Welcome Bonus
100%
Min Deposit: $100
Profit Split: up to 90%
Accounts: $25k-$200k
Challenge: 2-phase, no time limit
Welcome Bonus
10% up to $5,000
Min Deposit: $100
Welcome Bonus
$25
Min Deposit: $100
Welcome Bonus
100% Deposit Bonus
Min Deposit: €10
Welcome Bonus
100%
Min Deposit: $0
Welcome Bonus
$30
Min Deposit: $5
Bonus
NONE
Min Deposit: $100
Welcome Bonus
$50 Free
Min Deposit: $500
* T&C’s apply to each of the offers. Click “Trade” for more details
However, this is not enough. If you check on the MetaTrader platform under the Custom Indicators where the Pivot Points should be, you’ll have the surprise of not seeing it. The catch is to restart the trading platform as only then the platform will consider the new indicator. It is as simple as that.
Trading with Pivot Points
However, we’re not going to use the Pivot Points indicator from the MetaTrader platform as this time we’ll look at the JForex. The reason for this is the fact that the Pivot Points indicator is integrated into the standard offering on this trading platform, so we don’t need to follow extra steps to use it. In the technical analysis indicators, the Pivot Points is offered under the trend indicators tab, even though we should know by now that it is not such indicator. While it is applied to the actual prices, like most of the trending indicators are, it is mostly used like an oscillator.
Limitations
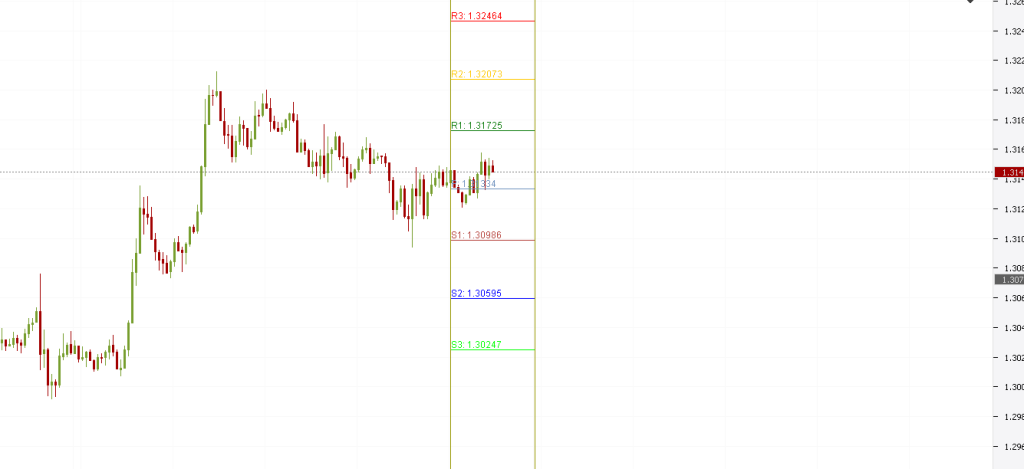
There are some limitations that come with the use of the Pivot Point indicators. The most important one is the fact that it cannot be applied on the bigger time frames. To tell the truth, it can, but it is useless, as it refers to levels formed around current prices. Therefore, if the indicator is applied to the monthly chart or even daily and weekly ones, there will be only some lines that are visible without the possibility to actually see the levels and interpret them If we go on the lower timeframes, the levels showed by the indicator can be seen. The image below shows the info and levels offered by the Pivot Points indicator after is plotted on a chart.
As you can see, we’re talking about some levels that are supposed to offer support and resistance for the future moves the market will make. Keep in mind that these levels are calculated started from the current price, and, as a consequence, will change with every candle that closes. If the indicator is applied to the hourly chart, by the time the hourly candle is closed the indicator will show different values for the support and resistance levels. By different, I mean new ones. On the other hand, if the indicator is applied on the four-hour timeframe, the indicator will keep the same levels of the support and resistance levels until the four-hour candle is closed. This means that the levels are projected based on the previous candle. Having that in mind, the bigger the timeframe, the more powerful the support and resistance levels are given by the Pivot Point indicator. However, these are only horizontal or classical support and resistance levels, not dynamic ones. For more about dynamic support and resistance areas and the comparison with the classical one, please visit the previous article on the Trading Academy here. As a short reminder, dynamic levels are more powerful in the overall picture than classical ones.
How to Use the Pivot Points Indicator
It all starts with the level in the middle of the range. The indicator projects seven levels: three to the upside of the chart and three to the downside. The one in the middle is the pivot one. In the picture above, it is the light blue line and it is the most important line of them all. As long as the price is above it, the tendency is to look for the three levels above as possible places where price will meet resistance. This means that either bulls will have to set the take profit level at those levels, or bears that want to fade a move higher will use them for entering the market. The opposite is true on the downside. If and when the price is moving below the pivot line as depicted by the indicator, the three levels below represent support. At those levels (there is a clear value the indicator shows for every level that is part of the Pivot Points indicator), bears are likely to close their shorts and bulls that bet on a reversal will look for a bounce. The indicator marks the above levels with R1, R2, and R3 as three different resistance levels, and with S1, S2, and S3 as three different support ones. The first one is the easiest to be broken, while the last one is the most difficult to pass by. Traders use scaling techniques with the Pivot Points indicators, especially those that look for trend reversals. To give you an idea, these traders are using Japanese candlestick techniques or other reversal trading strategies and patterns to spot potential turning points in a trend. These turning points are not some fixed level, but an area and the idea is to create an average for the overall position. This average is obtained by entering at different levels. Pivot Points indicator is great for averaging an entry. This is just an example of how the indicator can be used. Keep in mind that swing traders and even investors can use it, even though the analysis might come from the bigger timeframes. The way to use it is to go down the lower timeframes to time the entry, and this is where the indicator comes and makes a difference.
Recommended Further Readings
- Basics of Technical Analysis
– What is technical analysis, why it is important and why traders are using it. Advantages over fundamental analysis are highlighted as well. - Basics of Fundamental Analysis
– What is fundamental analysis, where to look for information that makes the market moving, advantages and disadvantages of trading based on fundamentals. - What are “Lots” in Forex Trading
– Explaining the concept of a lot of Forex trading, and from that heading to micro-lots, different trading accounts, and broker’s limitations. - Volume and Slippage – Value of a Pip and Execution Types
– Execution is important to every Forex trading and this article deals with the difficulties to trade big volumes with little or n- slippage. - What Makes a Good Forex Broker?
– Things to consider when deciding what broker to trade with. What are the factors that weigh the most in the decision-making process?
Other Educational Materials
- Financial market trading system with a hierarchical coevolutionary fuzzy predictive model. Huang, H., Pasquier, M., & Quek, C. (2009). IEEE transactions on Evolutionary Computation, 13(1), 56-70.
- Is technological learning a firm core competence, when, how and why? A longitudinal, multi-industry study of firm technological learning and market performance. Carayannis, E. G., & Alexander, J. (2002). Technovation, 22(10), 625-643.