Under the technical analysis patterns that are known by all traders, the head and shoulders has a central role. The name is so descriptive and the pattern so visible, that almost any technical analysis book for beginners starts with this pattern. Before moving into more details about what it is and what it is not, let’s list the elements of the head and shoulders pattern first:
- The head. Any head and shoulders pattern has a powerful swing higher followed by a similar one lower (in the case that the pattern forms at the end of a bullish trend) or the same thing in reverse if the pattern forms at the end of a bearish trend.
- The shoulders. The two shoulders, the left, and the right one are important elements to consider. Traders are looking at both price and time to interpret the moment the consolidation is completed, and they take their information to interpret from the data contained in the left shoulder.
- The neckline. As the name suggests, the neckline connects the base of the two shoulders. It is not mandatory that the neckline is horizontal, as it is not mandatory that the overall head and shoulders pattern is horizontal as well. In fact, the most powerful head and shoulders pattern are not horizontal…especially on the Forex market.
- The measured move. This is the distance price should travel (or the minimum distance price should travel) after the neckline is broken. As a side note, this is only a relative term as the move after the right head and shoulders pattern is identified is much, much more powerful.

Welcome Bonus
100%
Min Deposit: $100
Profit Split: up to 90%
Accounts: $25k-$200k
Challenge: 2-phase, no time limit
Welcome Bonus
10% up to $5,000
Min Deposit: $100
Welcome Bonus
$25
Min Deposit: $100
Welcome Bonus
100% Deposit Bonus
Min Deposit: €10
Welcome Bonus
100%
Min Deposit: $0
Welcome Bonus
$30
Min Deposit: $5
Bonus
NONE
Min Deposit: $100
Welcome Bonus
$50 Free
Min Deposit: $500
* T&C’s apply to each of the offers. Click “Trade” for more details
How to Treat a Head and Shoulders Pattern
A head and shoulders pattern is a reversal pattern. This is the most important statement to be said about it and this is the reason why its measured move is not that relevant. Often, traders end up staying only for the measured move and when this one is completed, they exit the trade automatically. The cost of opportunity in doing that is extremely high as, if head and shoulders are reversal patterns, the new trend has only begun.
Look for Neckline Retest
Even though it is not mandatory, there is a strong tendency for the neckline to be retested after its break. This is happening most of the times, though, so it is a good indication that the trend that follows a retest is a strong one. The measured move should be calculated only after the neckline can be drawn. We can form an educated guess about this based on the left shoulder’s structure, both in price and in time. A correct estimation of the measured move is to look at the distance from the head of the pattern until the neckline. Taking that distance and projecting it from the neckline’s break, will result in the target for the measured move. Again, the measured move should be seen only as a confirmation that the pattern worked and the previous trend ended. It is, by no means, the end of the new trend.
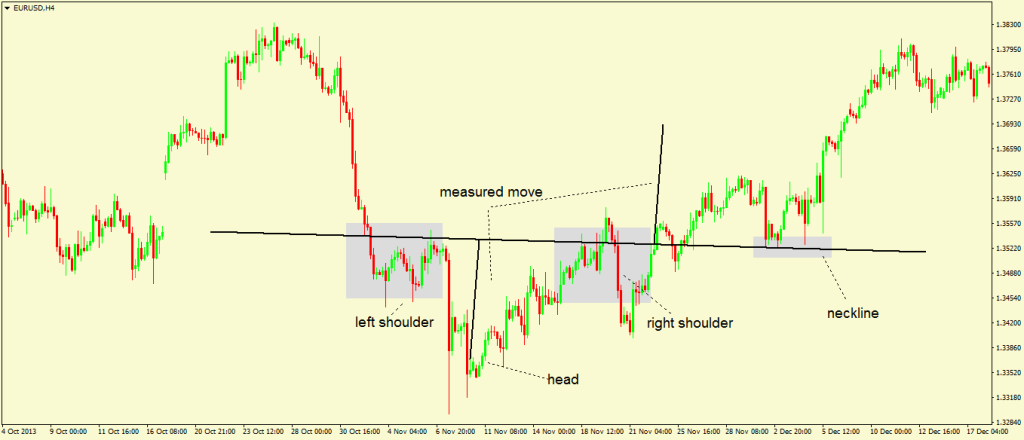
The EURUSD chart above shows an ugly head and shoulders pattern, that formed on the hourly chart some time ago. It is an inverted one, but the principles and the idea behind trading the pattern are the same for a regular one as well. The two shoulders, while different, show a clear delimitation for the neckline, and, the moment the neckline is broken offers a great opportunity to go long. The measured move is acting only as a confirmation of the fact that the previous trend lower, that almost vertical bearish trend is completed. Following that pattern, after the measured move was completed, price fully retraced that bearish move lower. Therefore, the head and shoulders pattern did its magic: it worked as a wonderful reversal pattern.

Imagine that traders will stay only for the measured move: they’ll miss almost half of the overall trend moving higher. This is because the true nature of the head and shoulders pattern is clearly misunderstood.
Project the New Trend
Even after completion, the head and shoulders pattern still has plenty of information to offer. It is showing the path for the new trend that was born. This new trend is identified by connected the two higher-lows in the head and shoulders pattern described above. The result is looking like the following image:

The information contained in the article that describes the way to use a trendline and how to correctly draw it is very useful here. The principle is the same, we’re just connecting two higher-lows with the idea to identify a new trend and the resulting trendline to offer the proper place to enter the new trend. It is beautiful how the entry point in the newly formed trend is the same following the head and shoulders neckline’s retest and the trendline rules. In such an instance, the right direction is reinforced by the fact that two different strategies point to the same trade from the same place. Because the head and shoulders pattern is such a popular reversal pattern, there is plenty of information to be found by a simple Internet search. While in theory everything looks clear, the pattern is distorted and it takes a lot of practice to be able to “see” when a shoulder is forming, to identify the head and to correctly draw the neckline. Like any patterns, the bigger the timeframes they appear on, the stronger the implications. If this is a reversal pattern and it forms on the monthly chart, by the time the measured move is confirmed and the distance traveled, the new trend has bigger implications on the overall picture. Moving forward, we’ll treat one continuation pattern, the bullish or bearish flag, only to show that reversal patterns are not the only ones that can form on a chart. Continuation patterns are as important as price often builds energy to break to new levels and confirm the previous trend of a bigger degree.
Recommended Further Readings
- Forex Trading – Explaining the Concept
– What is forex trading, generalities about trading the currency market. - Pending Orders Explained
– Different types of pending orders, how to set them, where to find them on the MetaTrader platform, and much more. - Forex Market Participants
– Who is participating in the Forex market, its structure, componence, and implications of different groups. - Trading on a Demo Account
– Explaining why trading on a demo account before going on a live one is mandatory for any serious trader. - Types of Forex Charts
– How many types of Forex charts exist, how to interpret them, advantages and disadvantages of each type, etc. - Basics of Technical Analysis
– What is technical analysis, why it is important and why traders are using it. Advantages over fundamental analysis are highlighted as well. - Technical Analysis – Support and Resistance Areas
– Defining what support and resistance areas are, how to find them using technical analysis and why traders are looking to buy into support and sell into resistance.
Other Educational Materials
- Foundations of technical analysis: Computational algorithms, statistical inference, and empirical implementation. Lo, A. W., Mamaysky, H., & Wang, J. (2000). The journal of finance, 55(4), 1705-1770.
- Head and shoulders: Not just a flaky pattern. Osler, C.L. and Chang, P.H., 1995.