A pennant is one of the most beautiful and powerful continuation patterns that exists under the technical analysis field. It is so powerful that, if traders are on the wrong side of the market, they will rarely get the chance to get out. This is happening because a pennant leaves little room for any kind of retracement. Before going into more details about what a pennant is and how to trade it, let’s see some generalities for this pattern:
- Pennants are bullish patterns. This means it is possible to see it forming only in bullish markets. If ever a pattern like a pennant is forming in a downtrend, it is not the same thing and most likely it is just another correction part of a complex pattern of a bigger degree (more about complex corrections when we’ll treat Elliott waves theory).
- Price builds energy. Price is trying to break an important resistance level and it will relentlessly try to do that until it is finally breaking.
- Little or no retracements. That is the most powerful thing in a pennant. The retracement levels are so small in the overall picture and the reaction on the long side so powerful on every dip, that bears will have a difficult time assessing the overall pattern.
- Price explodes higher after the pattern completes. Because of the nature of the pattern, it is followed by an impulsive move that is extremely aggressive. Even if the move that follows is not an impulsive one, it means it is a corrective wave of a bigger degree that started with an impulsive move of a lower degree. That’s even more bullish!

Welcome Bonus
100%
Min Deposit: $100
Profit Split: up to 90%
Accounts: $25k-$200k
Challenge: 2-phase, no time limit
Welcome Bonus
10% up to $5,000
Min Deposit: $100
Welcome Bonus
$25
Min Deposit: $100
Welcome Bonus
100% Deposit Bonus
Min Deposit: €10
Welcome Bonus
100%
Min Deposit: $0
Welcome Bonus
$30
Min Deposit: $5
Bonus
NONE
Min Deposit: $100
Welcome Bonus
$50 Free
Min Deposit: $500
* T&C’s apply to each of the offers. Click “Trade” for more details
How to Treat a Pennant
There’s only one way to treat a pennant: to look for buying opportunities. As mentioned earlier, the retracement levels are so small that it is difficult to wait for a dip to go long. Therefore, the simplest and more effective way is to simply enter during the pennant formation or to place a pending buy stop order at the highest point of the pennant. This way, it is impossible to miss the strong move that follows.
Wait for the Break
The first thing to do is to simply wait for the break. Unlike bullish flags, that make take “forever” to consolidate, the pennant has a small consolidation. If in the case of a bullish flag, the two trendlines that define the pattern are parallel, a pennant has the two trendlines pointing to an intersection point. It means a triangle is forming, and the angle of the two trendlines is aggressive. The chart below shows a pennant formation on the USDJPY pair on the four-hour time frame and the two methods described above worked like a charm as the right entries. This time frame allows for the pattern to be identified as the consolidation or the triangular area that defines the pennant took around sixteen candles.
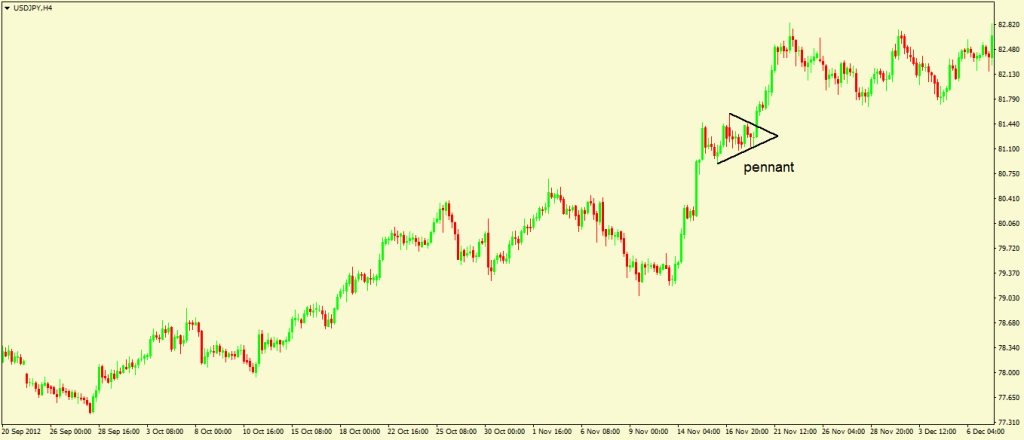
Multiple this with four trading hours that correspond to each candle and the result is more than two full trading days, almost three. In other words, if one is actively trading the USDJPY pair daily and pays attention to price action, it is virtually impossible to miss this consolidation. It is like the price is screaming to break higher, so little and shallow the retracements are. Either entering on the long side during the pennant formation or placing a pending buy stop order at the highest point, will do the trick for a profitable trade. Keep in mind that pennants are triangular formations that appear at the end of complex corrections or in the middle of them. These complex corrections, in strong trends, are forming at the start of the overall move. Look at the chart below as it shows the move that followed the pennant broke higher. Not only that the pennant built energy to break and so on, but it was followed by a super strong bullish trend.
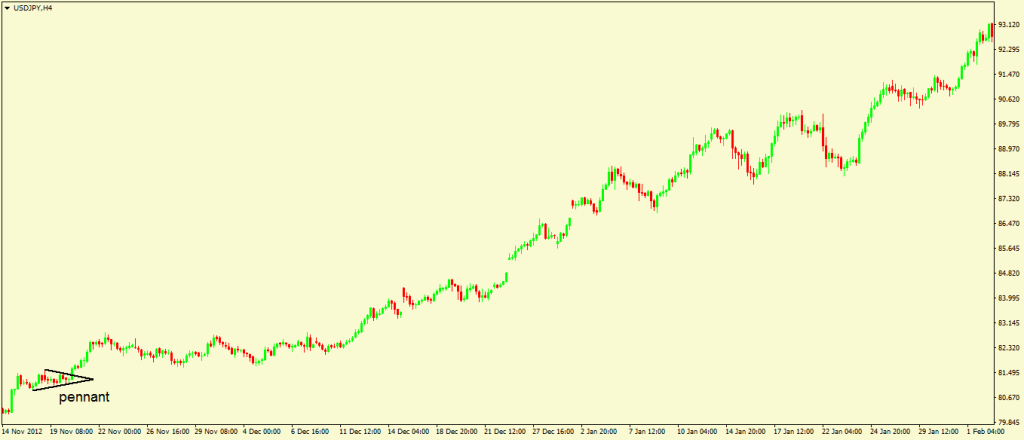
And all this happened without the lows in the pennant formation to be broken. If a picture is worth a thousand words, then this one is surely telling us everything we need to know about pennants and the power they have in showing strong bullish trends that are about to form.
Avoiding Fake Moves
Not all triangles are pennants, that is for sure. How do we know when a pennant is forming and what to do to correctly positioning for it? Here are a few tips and tricks to avoid being trapped in a pattern that looks like a pennant but it is not confirmed by future price action:
- A pennant should be followed by an explosive move higher. That is an almost vertical move. Look for green candles or bullish ones all over the place.
- Keep an eye on the triangle’s apex. The apex is the intersection point of the two trendlines that define the triangle subject to the pennant formation. At that intersection point, draw a horizontal line. The price action to follow the pennant formation should not pierce the apex’s line.
This simple rule is enough to invalidate a fake pennant formation and to keep traders on the right side of the market. For a long trade that is entered right after the pennant breaks higher, the apex line represents the stop loss for that trade. As for the take profit, there is virtually not one that comes to mind. The USDJPY chart illustrates perfectly why setting a take profit after a pennant formation is not a good idea. The trend that follows is an aggressive one and any take profit will result in the cost of opportunity being missing the trend. We want to avoid this at all costs. What can be done is to set a trailing stop order if the trading platform allows that. The value for the trailed stop should be set according to the timeframe the pennant appears on.
The bigger the timeframe, the bigger the trailing stop value should be. This way, riding a trend is possible with this beautiful continuation pattern.
Recommended Further Readings
- Forex Trading – Explaining the Concept
– What is forex trading, generalities about trading the currency market. - Why Trading with a Regulated Forex Broker?
– What is regulation for a brokerage house, why it is important, things to look for, how to check if the broker is telling the truth, etc. - Benefits of Mobile Forex Trading
– Pros and Cons of mobile trading, highlighting the net benefits of it. - Explaining Commissions in Forex Trading
– What type of Forex trading accounts are subject to paying commissions, what does it means and is this a good or a bad thing? - Opening a Live Trading Account
– Steps to open a live trading account with a Forex broker, starting with the time taken for the whole process, documentation to be sent, verification process, trading platforms to download, etc. - What are “Lots” in Forex Trading
– Explaining the concept of a lot of Forex trading, and from that heading to micro-lots, different trading accounts, and broker’s limitations. - Volume and Slippage – Value of a Pip and Execution Types
– Execution is important to every Forex trading and this article deals with the difficulties to trade big volumes with little or n- slippage.
Other Educational Materials
- What do we know about the profitability of technical analysis?. Park, C.H. and Irwin, S.H., 2007. Journal of Economic Surveys, 21(4), pp.786-826.
- “Technical analysis in foreign exchange markets: evidence from the EMS.” Fernández-Rodríguez, Fernando, Simon Sosvilla-Rivero, and Julian Andrada-Felix. Applied Financial Economics 13, no. 2 (2003): 113-122.