Technical analysis as a way to chart the markets started in the Western world with some classical patterns that we’re going to treat here on the Trading Academy as well: head and shoulders, rising or falling wedges, ascending or descending triangles, bullish or bearish flags, pennants, etc. These patterns are designed to show either continuation or reversal prices to come. Lately, more and more people are seeing the benefits of the Japanese approach to technical analysis: the candlesticks approach. So powerful are these candlestick techniques, that they are widely used now around the world and market technicians cannot ignore these formations. There are multiple possibilities to set up a trading chart, and, besides a line or a bar chart, candlesticks can be chosen too. Exactly like a bar, a candlestick is showing the opening and closing prices, but it offers something more in between. Japanese candlestick techniques as part of the technical analysis are powerful trading tools. They can be either reversal or continuation patterns, but mostly reversal ones. In the Trading Academy project, we will treat the Japanese approach to the technical analysis as well, but before going into more details, it is mandatory to explain what a candlestick is and why it is important to use a candlesticks chart above all. There are only advantages in doing that.

Welcome Bonus
100%
Min Deposit: $100
Profit Split: up to 90%
Accounts: $25k-$200k
Challenge: 2-phase, no time limit
Welcome Bonus
10% up to $5,000
Min Deposit: $100
Welcome Bonus
$25
Min Deposit: $100
Welcome Bonus
100% Deposit Bonus
Min Deposit: €10
Welcome Bonus
100%
Min Deposit: $0
Welcome Bonus
$30
Min Deposit: $5
Bonus
NONE
Min Deposit: $100
Welcome Bonus
$50 Free
Min Deposit: $500
* T&C’s apply to each of the offers. Click “Trade” for more details
Defining a Candlestick’s Elements
When talking about a candlestick, the starting point should be the timeframe we’re referring too. The principle of a candlestick and its elements are the same, only the interpretation should be different. A perfect example is a comparison between the monthly and the hourly timeframes. If the candlestick chart is selected on both timeframes, the candles will look the same, in the sense that they are formed out of the same elements, but the interpretation is different: one candle will close in one hour and the other one in a month. This is important because a candlestick should be interpreted only AFTER it is closed. During the opening time, it can take various shapes and forms, it can be bullish or bearish or even show continuation patterns: nothing should be considered until the candle is closed.
Body of the Candle
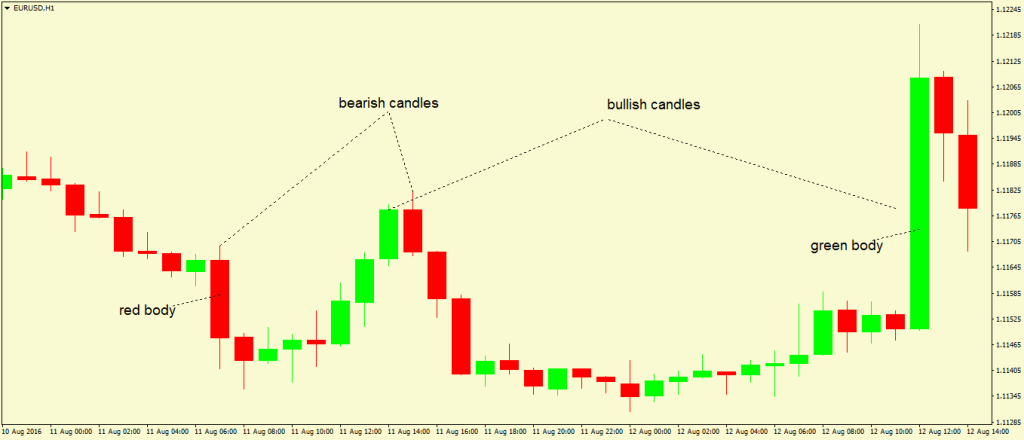
The body of the candle can take any color possible, but the standard ones are green and red. A green body shows a bullish candle, while a red body a bearish one. As a definition, the body of a candle is the difference between the opening and closing price. If this difference is positive, the body is green and the candle bullish. If it is negative, the bearish candle is shown as a red one. The bigger the difference between the opening and closing price of a candle, the bigger the body and the candle is.
The image above shows red and green candles and they represent bearish and bullish conditions during the formation of these candles. In this case, the timeframe is the hourly one. The body is the thick area in a candle. However, not all candles travel from the absolute high to the absolute low, and, as such, the body of a candle varies.
Shadow of the Candle
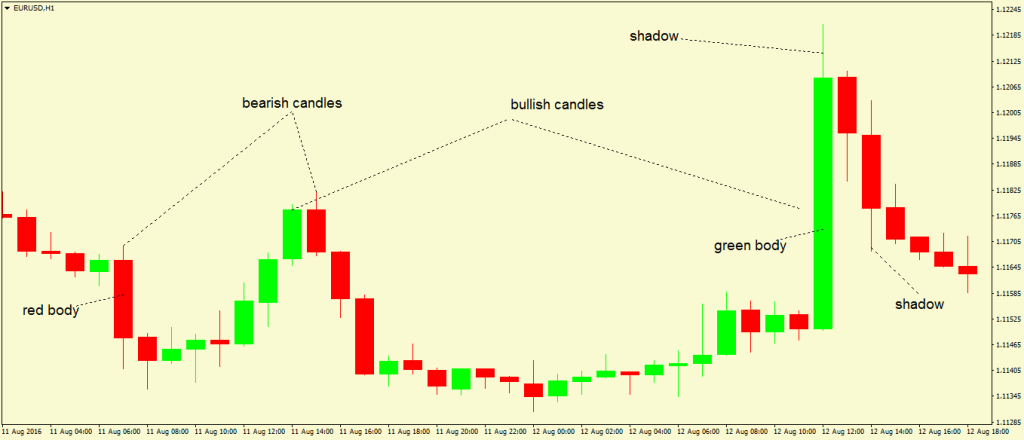
The shadow of the candle is the line above or below its body, and it can be either bullish or bearish, or green or red. As a rule of thumb, the shadow of a candle always has the same color as its body. The reason why candles have shadows is that, again, it is not mandatory for them to close at their highest or lowest point. In fact, it is rarely when this happens. A shadow shows the fact that price, sometimes during the candle’s formation, was reaching a specific value, even though before the candle to close, that level was retraced. Shadows can be small or short, and usually, they represent violent fake moves. The Forex market is well known for its fake moves and the ability to attract traders on the wrong side, only for the price to make a V shape recovery and retrace the previous move completely. In terms of candlestick charts, this is happening when candles have a big shadow.
The same chart as the one above shows on the right side of it the shadows of two candles: one bullish and one bearish. The shadows respect the nature (color) of their candles, and, a quick look at the other candles there, shows that shadows are different for every other candle. These are the two elements that make a candlestick: the body and the shadow of a candle. When treated as continuation or reversal patterns, one or a group of candles are considered. Different types of shadows and bodies are having different meanings for the patterns, and, again, it is important to wait for the candle to close. This is the same thing like when trading with indicators: if you don’t wait to see the closing value or the printing value of the indicator, how will you know what the right one is? Trading with candlestick leaves little room for interpretation as the Japanese candlestick techniques are exact and offer great opportunities. Not only that reversal is spotted, but the setup gives powerful risk-reward ratios that are a crucial part of any sound money management system. It is not possible to trade the Forex market or any other market and has only winning trades. The idea is to have more winners than losers as this is the only way the account will grow in time. Discipline is key here, and discipline is given by technical analysis. Fundamental analysis may give the reason why the market is moving, but the direction is always given by both technical and fundamental factors. On top of that, the technical analysis gives the risk and reward ratio, and this is what defines a good strategy from a bad one. We will use the concepts of a candlestick as described here in further articles in our projects, so make sure you understand the importance of this one.
Recommended Further Readings
- Forex Trading – Explaining the Concept
– What is forex trading, generalities about trading the currency market. - What are “Lots” in Forex Trading
– Explaining the concept of a lot of Forex trading, and from that heading to micro-lots, different trading accounts, and broker’s limitations. - Volume and Slippage – Value of a Pip and Execution Types
– Execution is important to every Forex trading and this article deals with the difficulties to trade big volumes with little or n- slippage. - Basic Trading Styles – At Market or with Pending Orders
– Showing the possibilities a trader has, explaining the advantages and disadvantages of trading at the market or with pending orders. - Pending Orders Explained
– Different types of pending orders, how to set them, where to find them on the MetaTrader platform, and much more. - Forex Brokers Types – ECN or STP?
– What is ECN, STP, how d- brokers deal with client’s orders, advantages, and disadvantages of the tw- types.
Other Educational Materials
- Candlestick technical trading strategies: Can they create value for investors?. Marshall, B. R., Young, M. R., & Rose, L. C. (2006). Journal of Banking & Finance, 30(8), 2303-2323.
- The obstinate passion of foreign exchange professionals: technical analysis. Menkhoff, L., & Taylor, M. P. (2007). Journal of Economic Literature, 45(4), 936-972.